BIASED
Encyclopedia of Distorted
Thinking Patterns
︎︎︎ Research
︎︎︎ Concept
︎︎︎ Content
︎︎︎ Visual Design
︎︎︎ Behavioural Design
︎︎︎ UI/UX Design
︎︎︎ Prototyping
︎︎︎ Animation
Thinking Patterns
︎︎︎ Research
︎︎︎ Concept
︎︎︎ Content
︎︎︎ Visual Design
︎︎︎ Behavioural Design
︎︎︎ UI/UX Design
︎︎︎ Prototyping
︎︎︎ Animation
Our brain is an excellent thinking apparatus that we can use to accomplish a variety of life tasks. However, we all experience situations in which we don't think and act quite rationally: we stick with our overpriced phone plan even though there are significantly cheaper offers, we treat ourselves to an extra serving of potato chips because we've been exercising for half an hour, or we come home with our fifth pair of sneakers from the summer sale even though there is no more room for it on the shoe rack.
Such situations do not arise randomly, but can be traced back to systematic, faulty thinking patterns: cognitive biases. Our brains keep unconsciously luring us into these thinking traps, which contribute to our inability to perceive and judge our environment completely objective.
»biased« was my graduation project at Hochschule Mainz. It is an encyclopedia that offers an explorative overview of the most significant cognitive biases, aiming to raise awareness of how our thinking and decision-making are often less rational than we assume.
»biased« was my graduation project at Hochschule Mainz. It is an encyclopedia that offers an explorative overview of the most significant cognitive biases, aiming to raise awareness of how our thinking and decision-making are often less rational than we assume.
One of the central features of »biased« is
an interactive infographic which contains
180 cognitive biases.
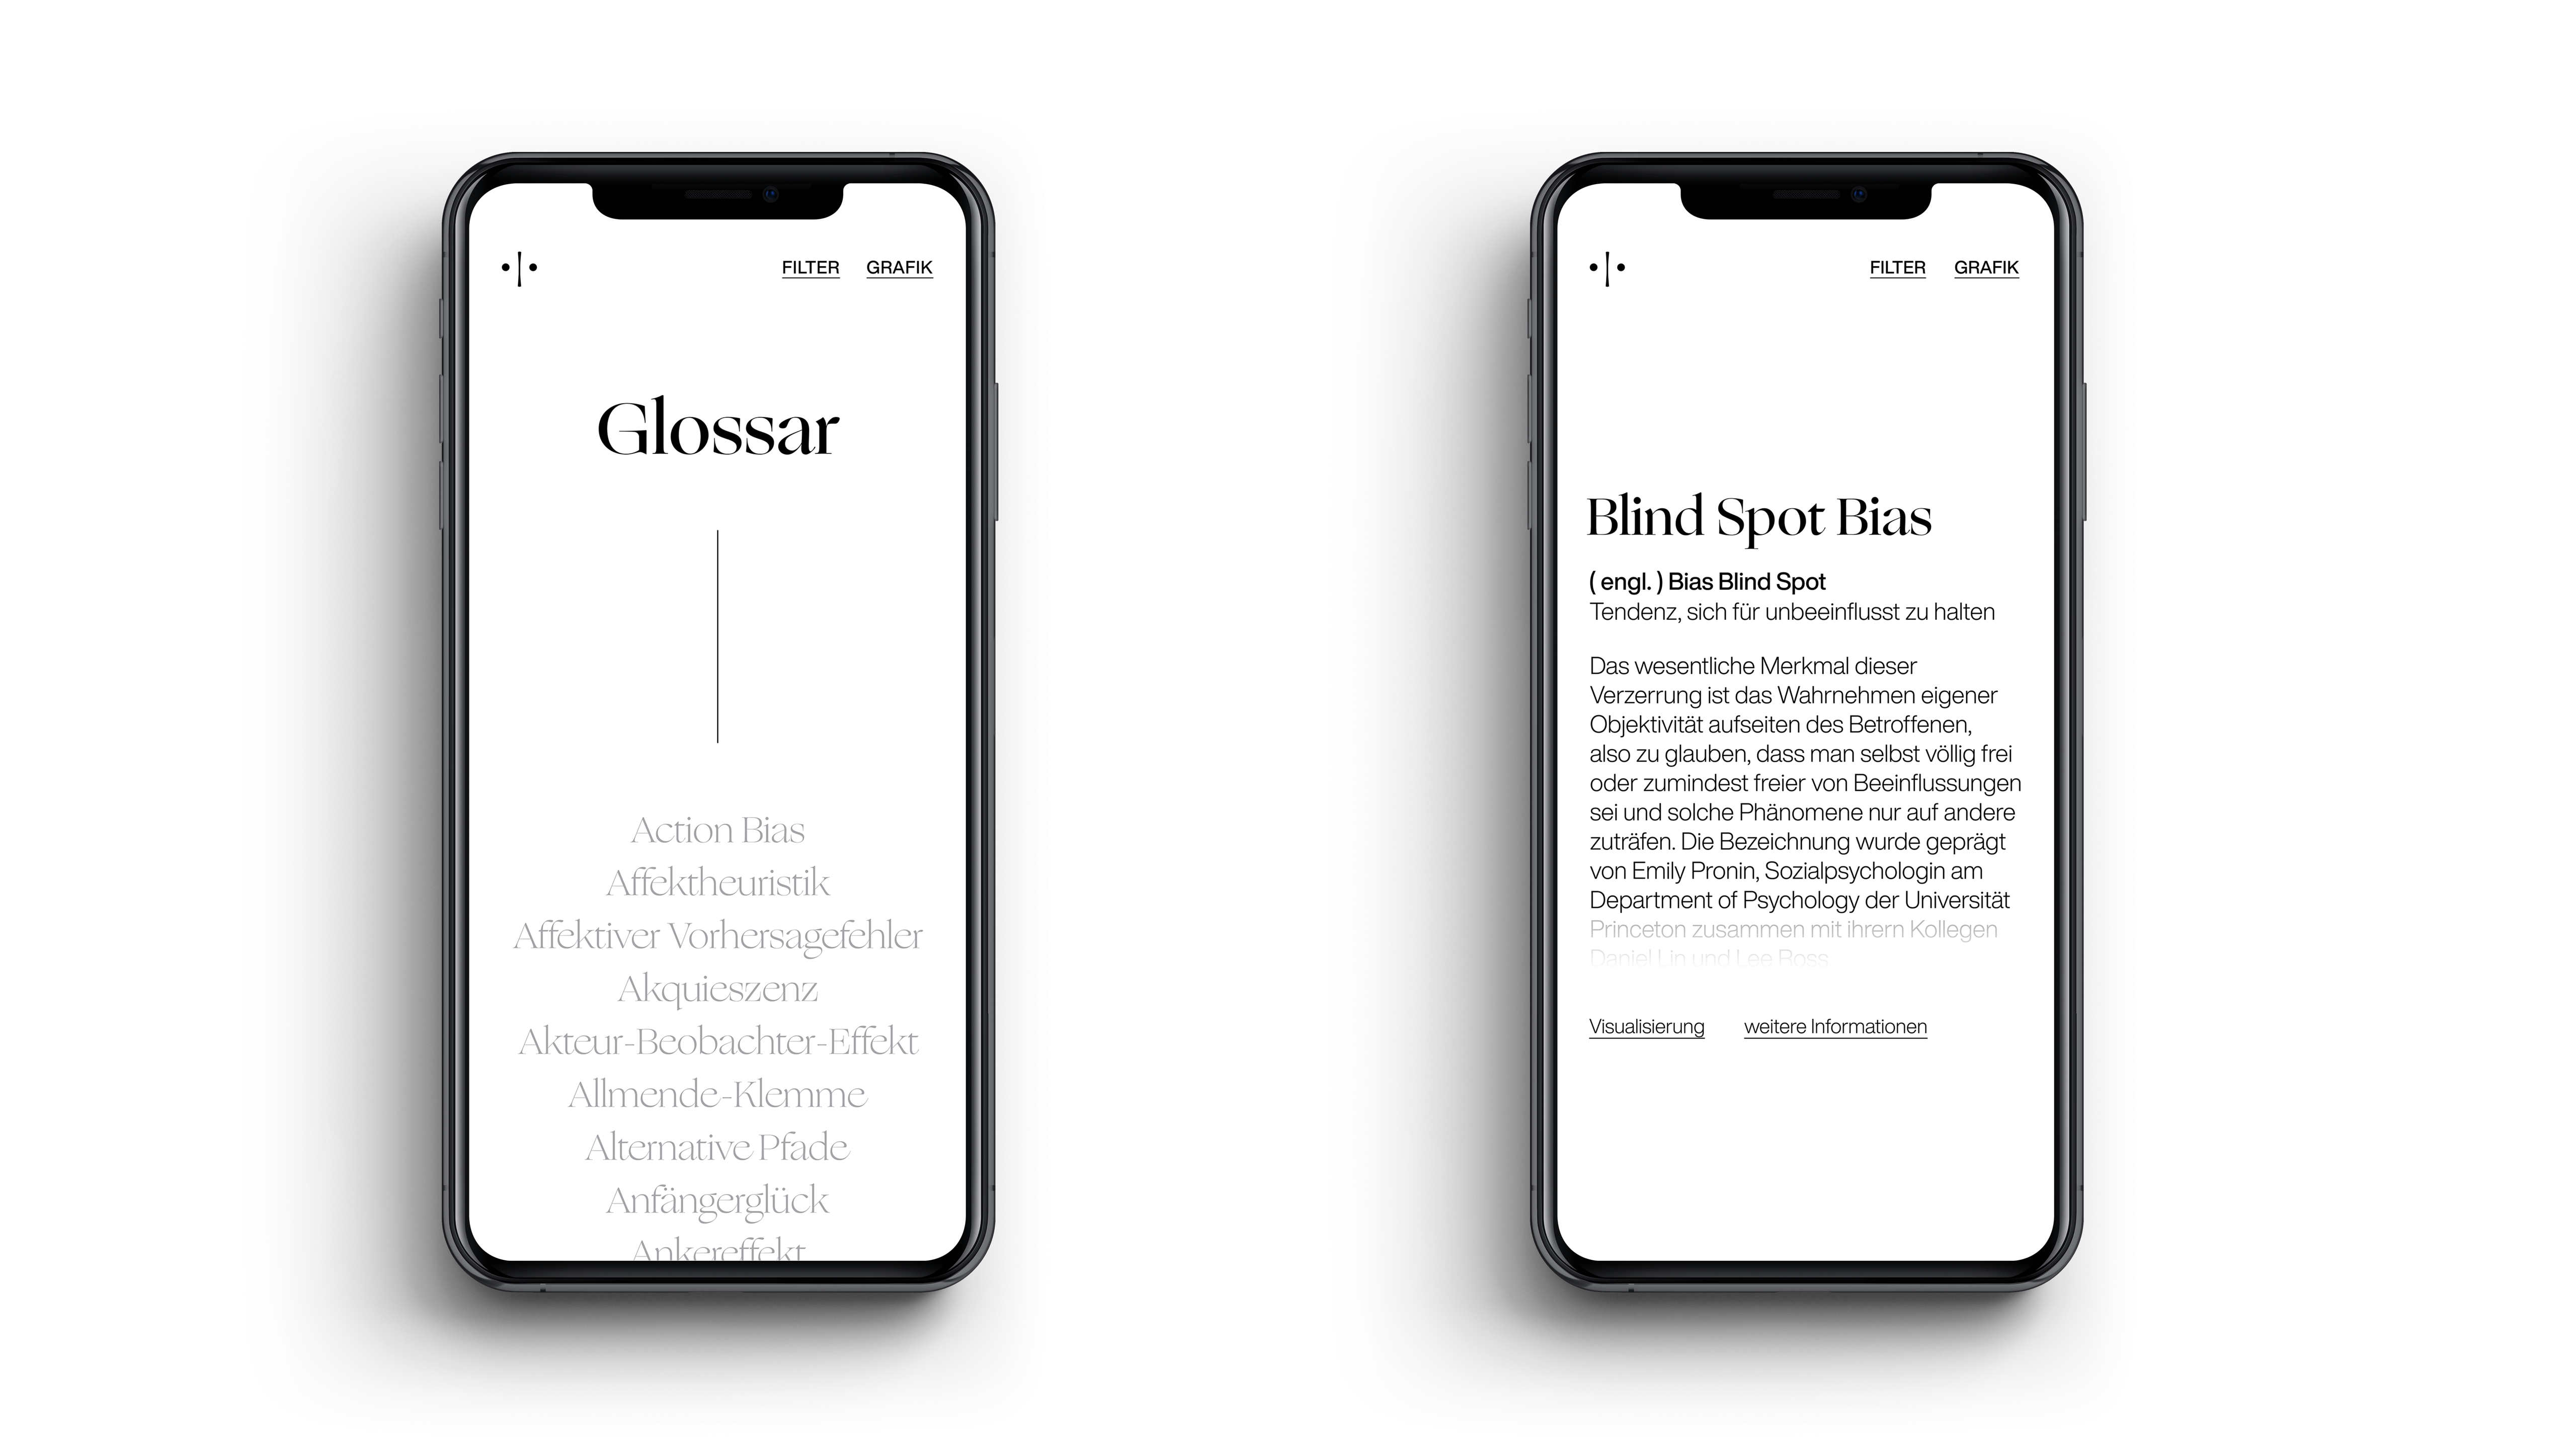
The encyclopedia consists of two levels: infographic and glossary. One the first level, the infographic stands for »fast thinking« and displays all essential information intuitively. On the second level, the glossary stands for »slow thinking« and offers detailed information as well as in-depth research options. Switching back and forth between the two levels allows learners to work and discover at their own pace.
Sample application of the interactive
infographic with animations.
infographic with animations.
The glossary is sorted alphabetically and invites you to delve deeper into the topic. All 180 listings include a definition, a short info text as well as an external link for further information. There you can find in-depth resources such as journal articles or academic papers. Clicking on the »visualization« item takes you back to the infographic.
 Logo reveal and loading animation: the key visual symbolizes
 the distinction between fast and slow thinking and serves
primarily as a functional element on the website.
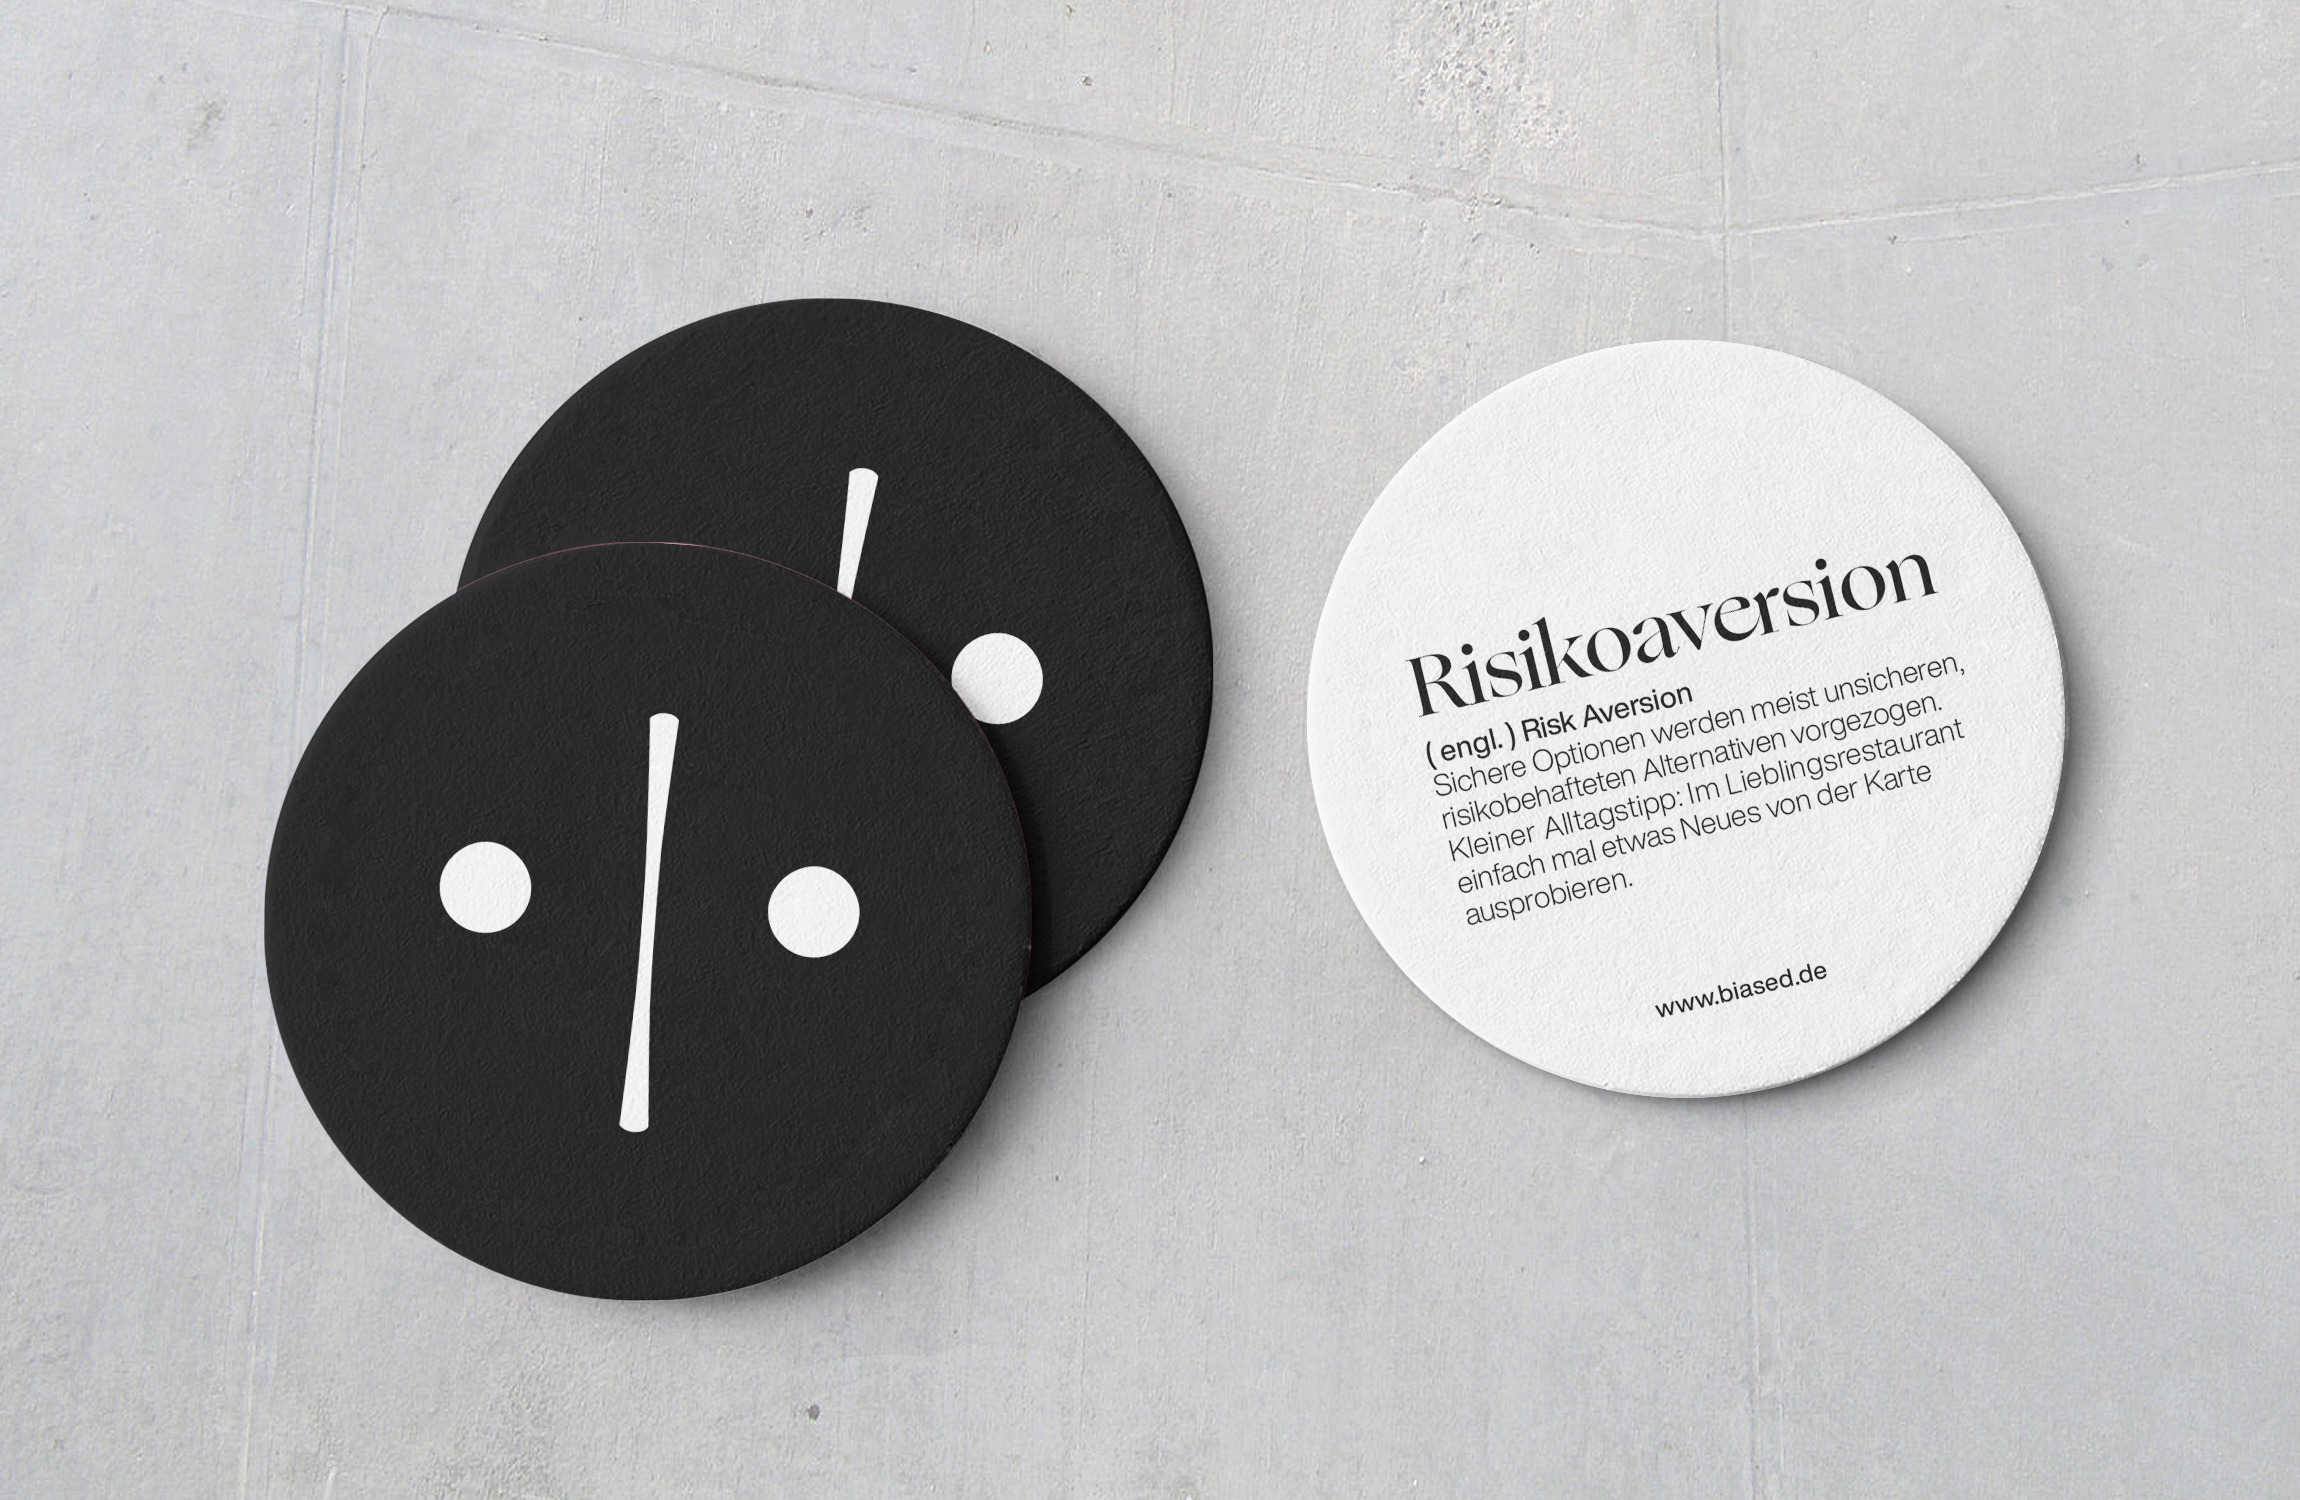 Everyday tips: »risk aversion« – try something new from
the menu and let yourself be pleasantly surprised.
Copyright © 2026 - all rights reserved Impressum Datenschutz